Laser Scanning
Demonstration of the 3D construction using laser scanners:
Acquisition, Processing, and Result Analysis.
View in Full Screen
By actively emitting lasers and taking a distance and angle measurement at every direction when rotating 360° in the horizontal axis and approximately 270° in the vertical axis. The scanner rapidly captures the surface shape of objects, buildings, and landscapes. Construction of a full 3D model involves combining multiple scans obtained from different viewing angles, or the admixing of other known constraints. More details will be illustrated in the following three parts.
1. Acquisition
Several points need to be paid attention during data acquisition. Firstly, ensuring enough overlap between adjacent scans for further registration to get a complete model. Secondly, it is suggested to finish all scans under similar brightness conditions. Thirdly, ensure no obstruction in the laser scanner's view when taking color images during the last few minutes for each scan. Fourthly, manual registration is more recommended than automatic one to freely choose which parts of point cloud or color information you want to reserve or delete. Lastly to scan the roof, put the laser scanner far away from targeted buildings might help if the roofs are tilted. If not, UAV can help get a full roof and be combined with laser scanning data.
Resolution is the total number of points and it decides the point density. Usually, the longer the distance from the scanning position to the object is, the higher the resolution requires. Quality represents the number of points scanned per second. Higher Quality corresponds to data of higher quality via diverse measurement rates or additional noise compression but meanwhile longer scanning time.
1.1. Zoller + Fröhlich 5016 Laser Scanner (Z+F)
Z+F was mainly for inside acquisition for the chapel. As shown in the Figure 1, ten Ultrahigh Resolution and High Quality's scans were done for downstairs under every one and a half beam since they are most concerned part of the project. Figure 2 shows four scans with Superhigh Resolution and Normal Quality for upstairs. The dots in the figures represent scanning locations.
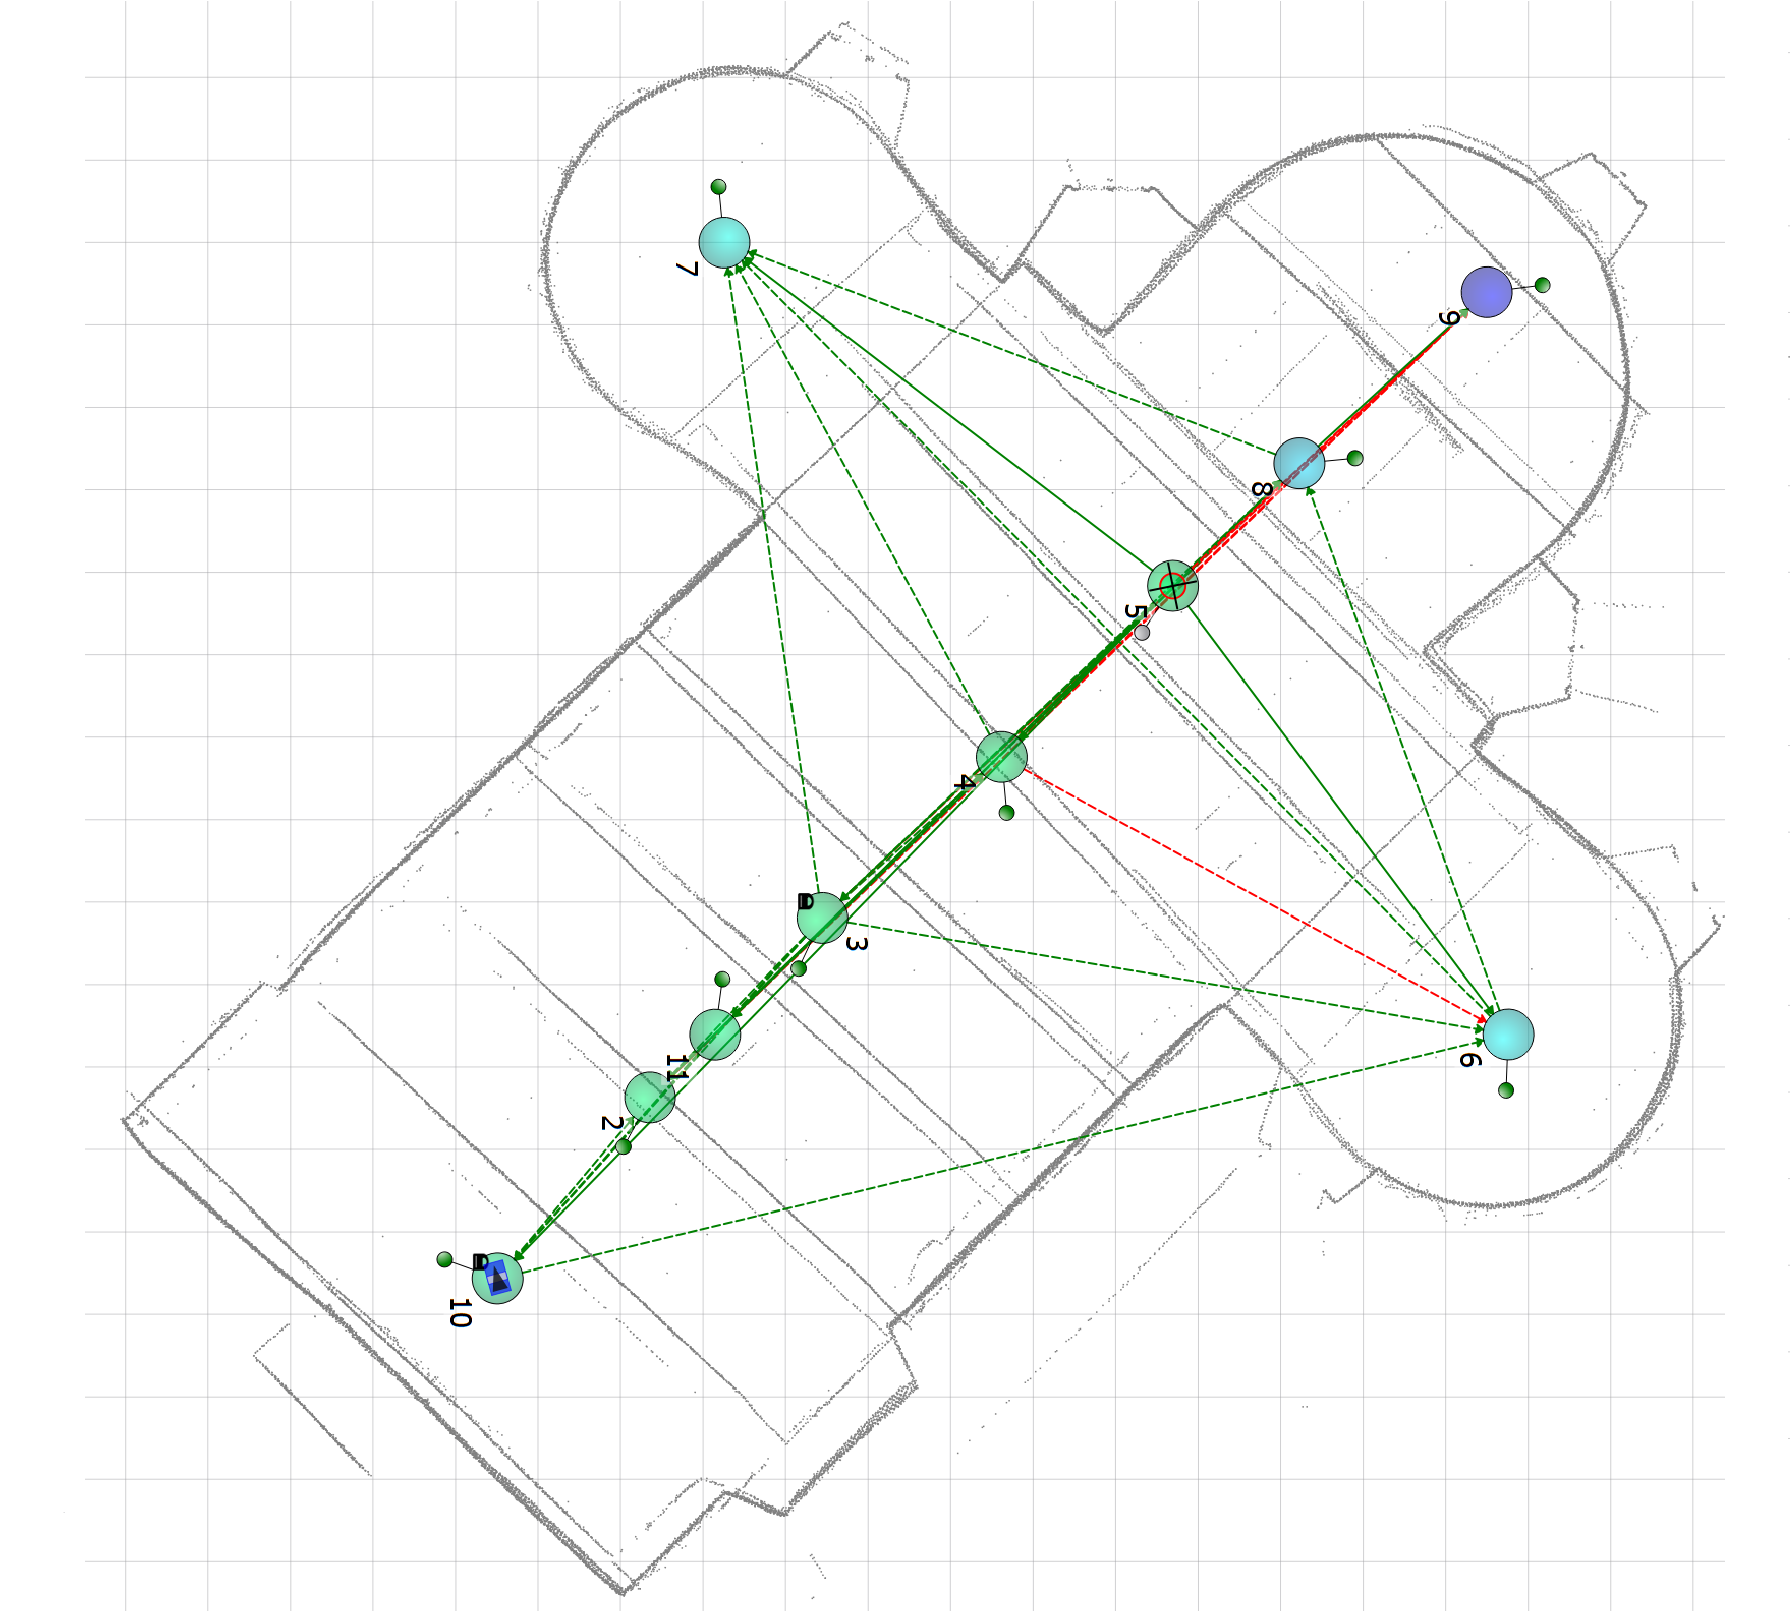 Figure 1. The Z+F scanning positions downstairs.
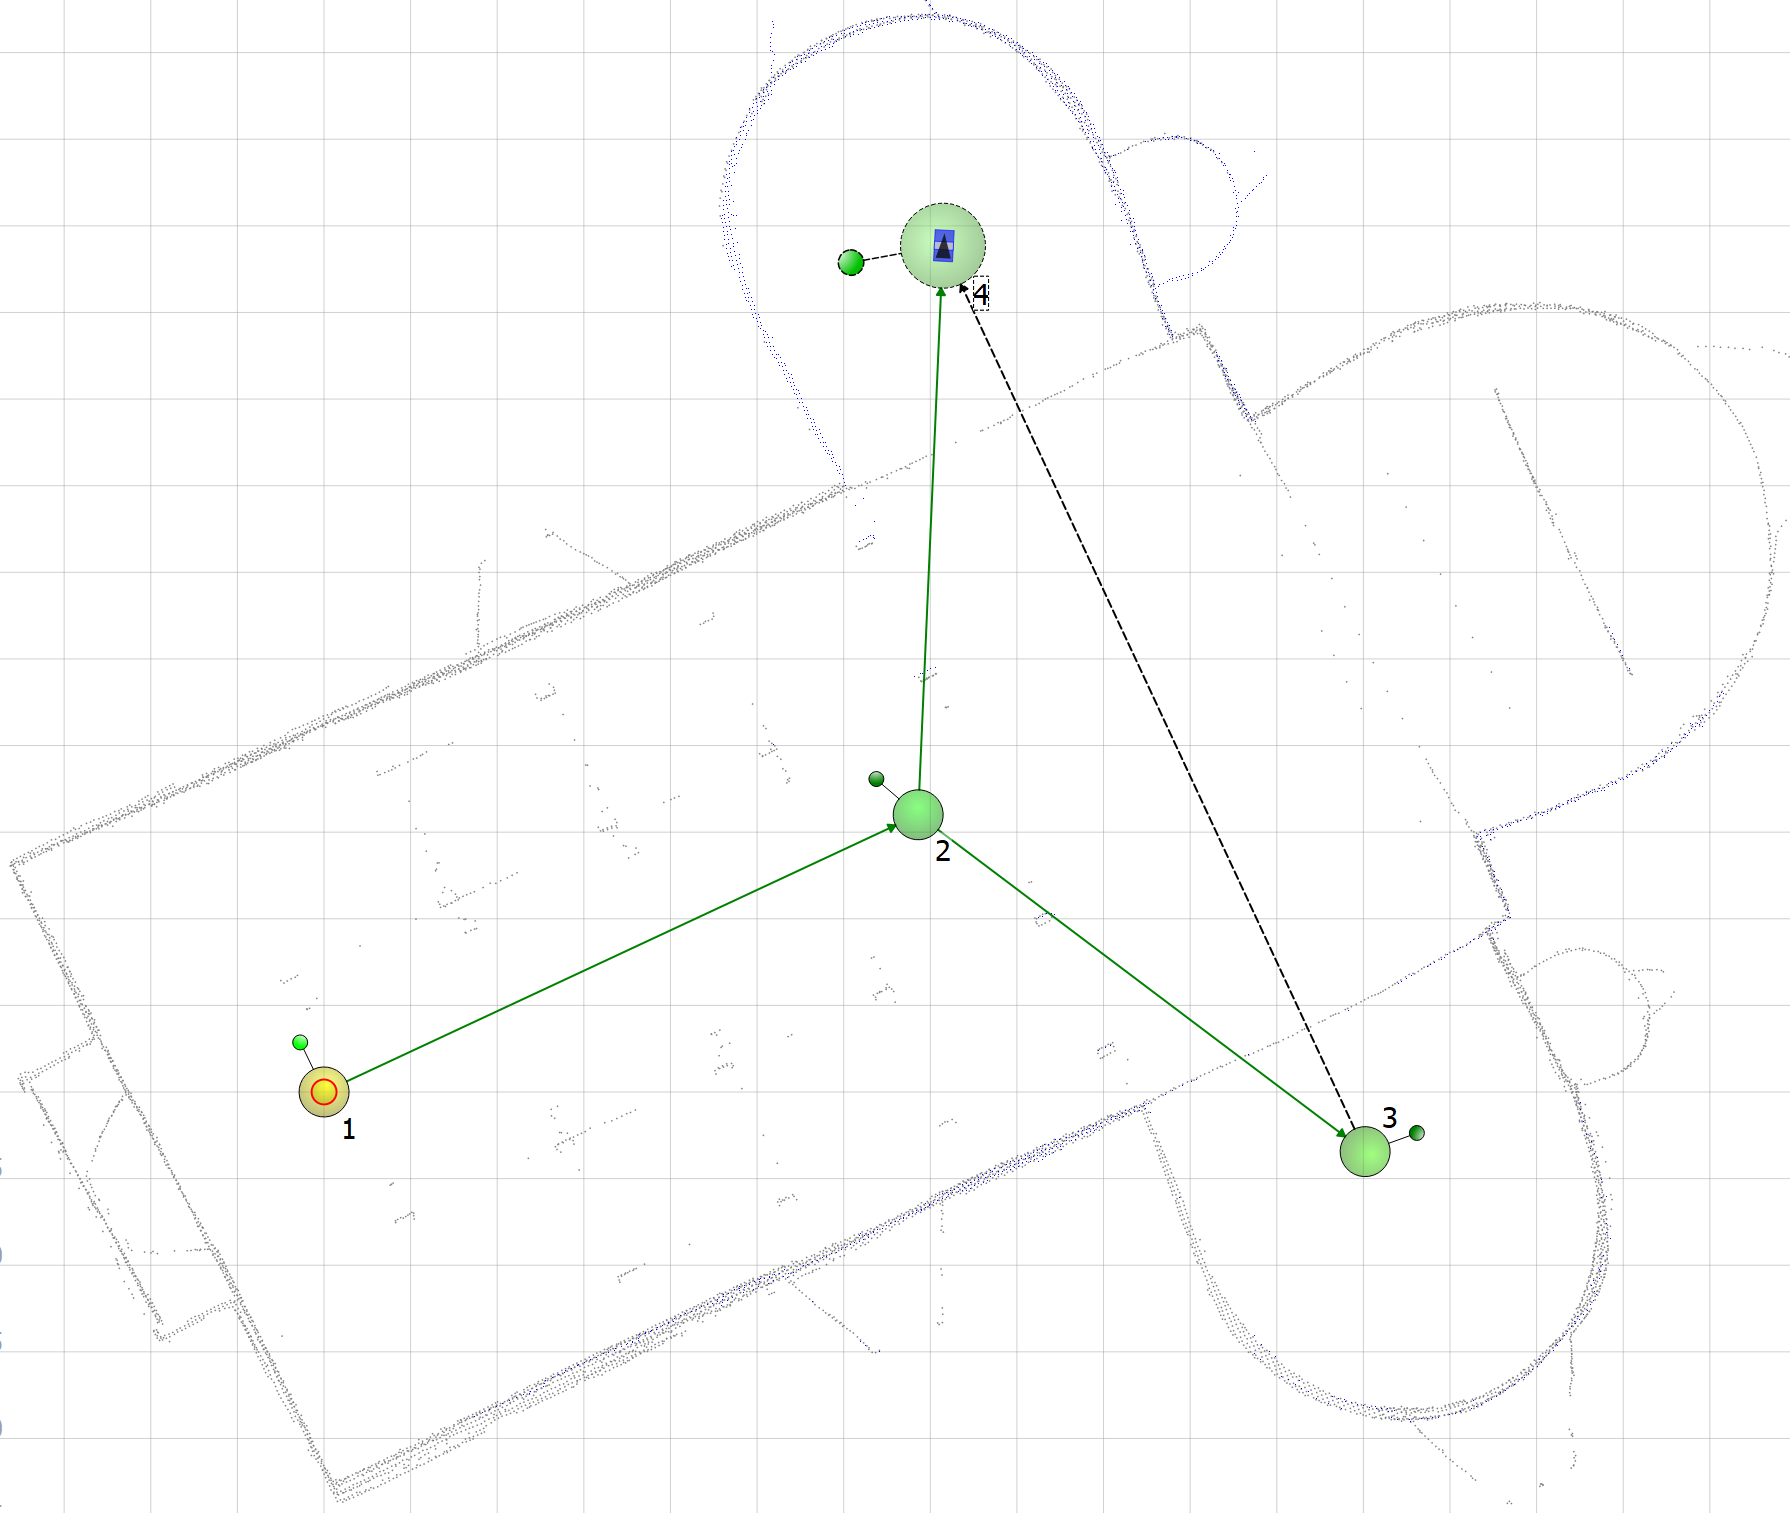 Figure 2. The Z+F scanning positions upstairs.
1.2. Faro Focus 3D Laser Scanner (Faro)
Faro was applied to obtain the outside of the chapel. Altogether 24 measurements were done using 1/4 Resolution, 4x Quality, and color-image mode. To transfer local models into the global Swiss one, one more scan of four tripods with installed spheres was done to apply global coordinates as the center of spheres, using 1/1 Resolution and 2x Quality. As Figure 3 shows, the scanning positions locate at the black dots.
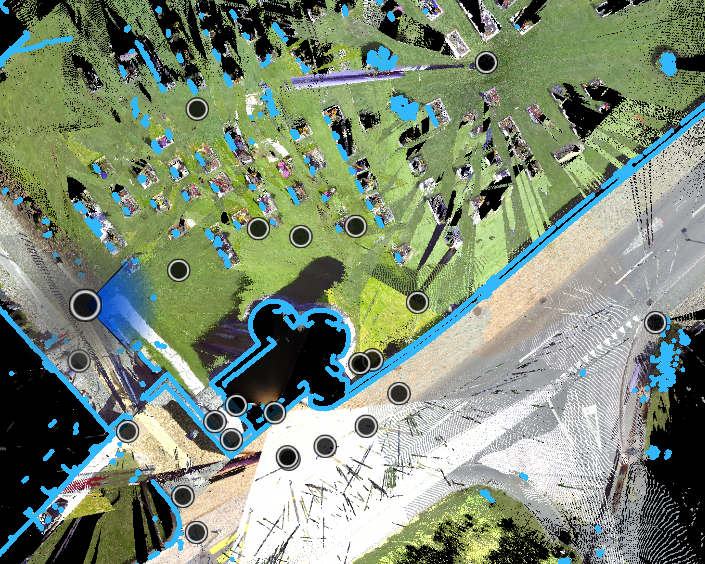 Figure 3. The 24 Faro scanning positions outside.
1.3. Other applied instruments
Leica BLK 360 Imaging Scanner (BLK)BLK was used to scan the inside of the chapel to make a comparison with other methods. It is easier to operate and faster than Z+F and Faro. Moreover, it achieves almost the same accuracy as 1/4 resolution of Faro.
GeoSLAMWe tried GeoSLAM. A GoPro was installed to take videos later providing color information. During measurements, it requires to start and end at the same position, and to walk backward while walking through the door.
2. Processing
As Figure 4 shows, the general workflow to process point cloud is: registration, cleaning noise, (subsample), creating and cleaning mesh. Firstly, for multiple separate scans, select at least three common points to align scans and register to a full model. Then, uninterested parts (this could also be done before registration) and noise data can be deleted. Subsampling is sometimes necessary for further creating meshes to lower down the data volume. Finally, the model with a continuous surface can be achieved by creating and cleaning meshes.
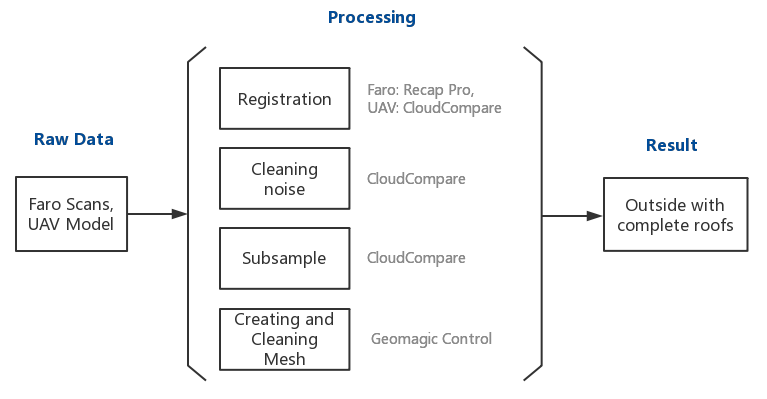 Figure 4. The workflow of point cloud processing.
Three software were most used in the processing part: Recap Pro, CloudCompare, and Geomagic Control. As far as from our experience, for a large dataset like about 700 million points, Recap Pro is the only one ever to successfully import data in our cases. As a result, for such big dataset, it is suggested to first load them in Recap Pro and delete the non-targeted part to decrease the data volume. Registration can then be done in Recap Pro, or after exporting as .ply format, import separate data into CloudCompare and do registration. The registered and merged data can be cleaned and subsampled in CloudCompare (it is tricky Geomagic Control sometimes fail to create meshes with color information from hundreds of millions of points). Finally, create meshes and improve them by Mesh Doctor and Fill Holes in Geomagic Control since it is the only one among these three to create meshes.
Especially, there is one matching software: Z+F Software for Z+F laser scanner, and Faro Scene software specially for Faro laser scanner. Import, registration, and something else could also be achieved on the two software.
3. Result Analysis
Comparison of point cloud between Z+F and BLK, Z+F and GeoSLAM, Z+F and Nikon (from Photogrammetry part), and Faro and GeoSLAM was made in CloudCompare software. The color bar shows the difference between the point cloud at the same location. Red color means no differences, green in the middle is 3 cm, and blue in the bottom is 6 cm. As shown from the following four graphs, the relative differences of the point cloud between various instruments are all almost less than three centimeters except for some missing parts, e.g. the door in Figure 5. Actually there should not be such big differences since the accuracy of all instruments are about millimeters. This may result from that the point clouds are not very accurately registered at the exact same position and thus there is a shift between all point clouds. From the comparison between GeoSLAM and Z+F in Figure 5, and GeoSLAM and Faro in Figure 7, the compared point cloud is sparser than others since GeoSLAM only captured about one million points while Z+F, Faro, and BLK are at the level of hundreds of millions of points.
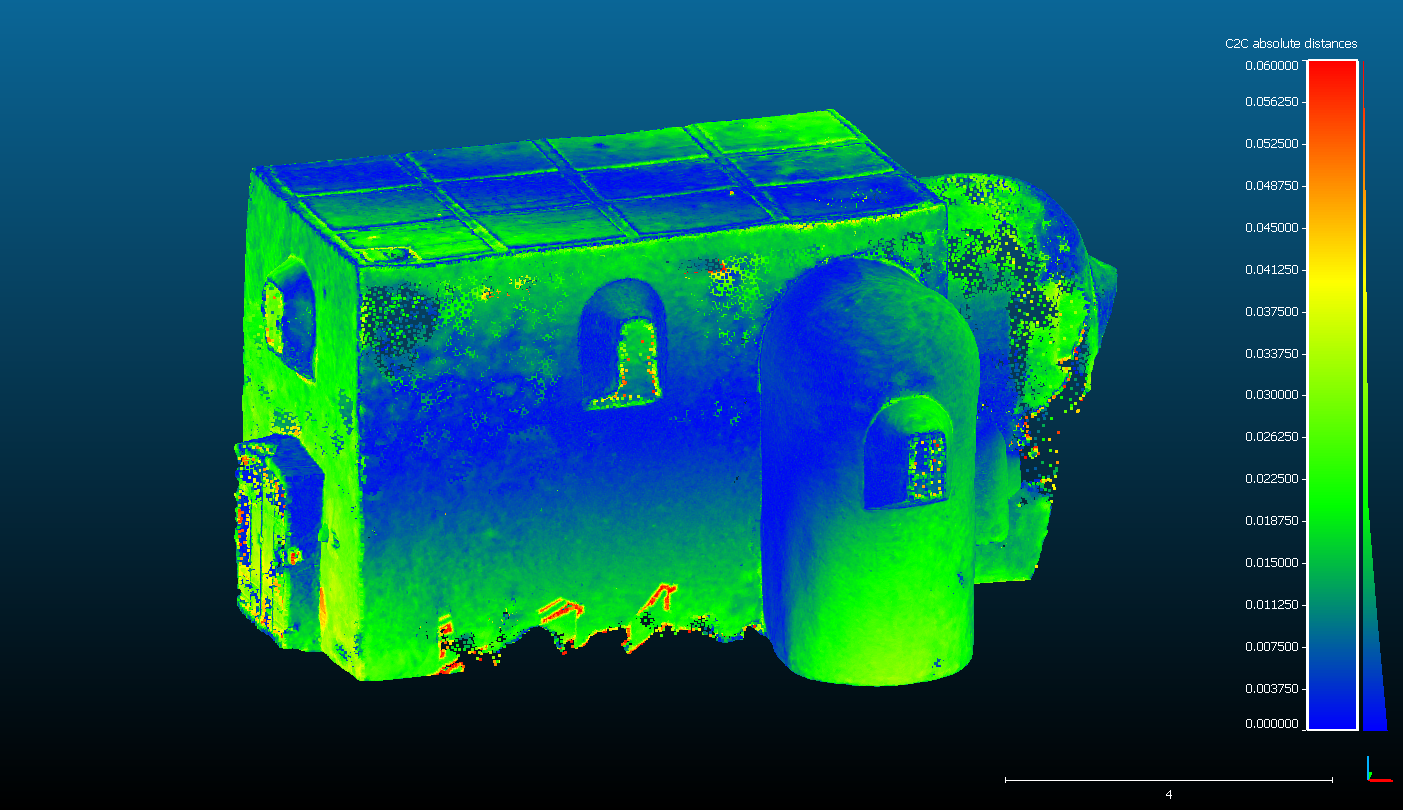 Figure 4. The comparison between Z+F and BLK.
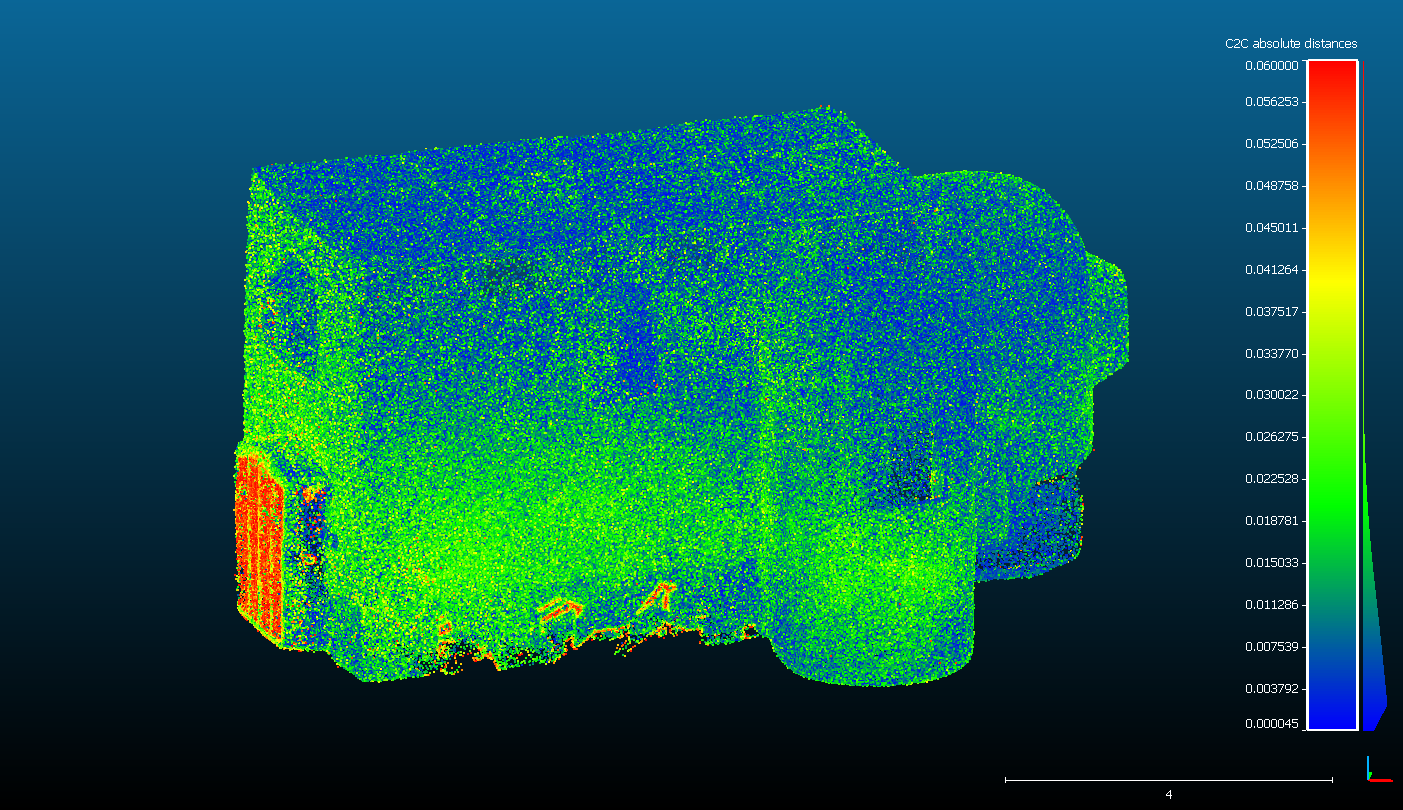 Figure 5. The comparison between Z+F and GeoSLAM.
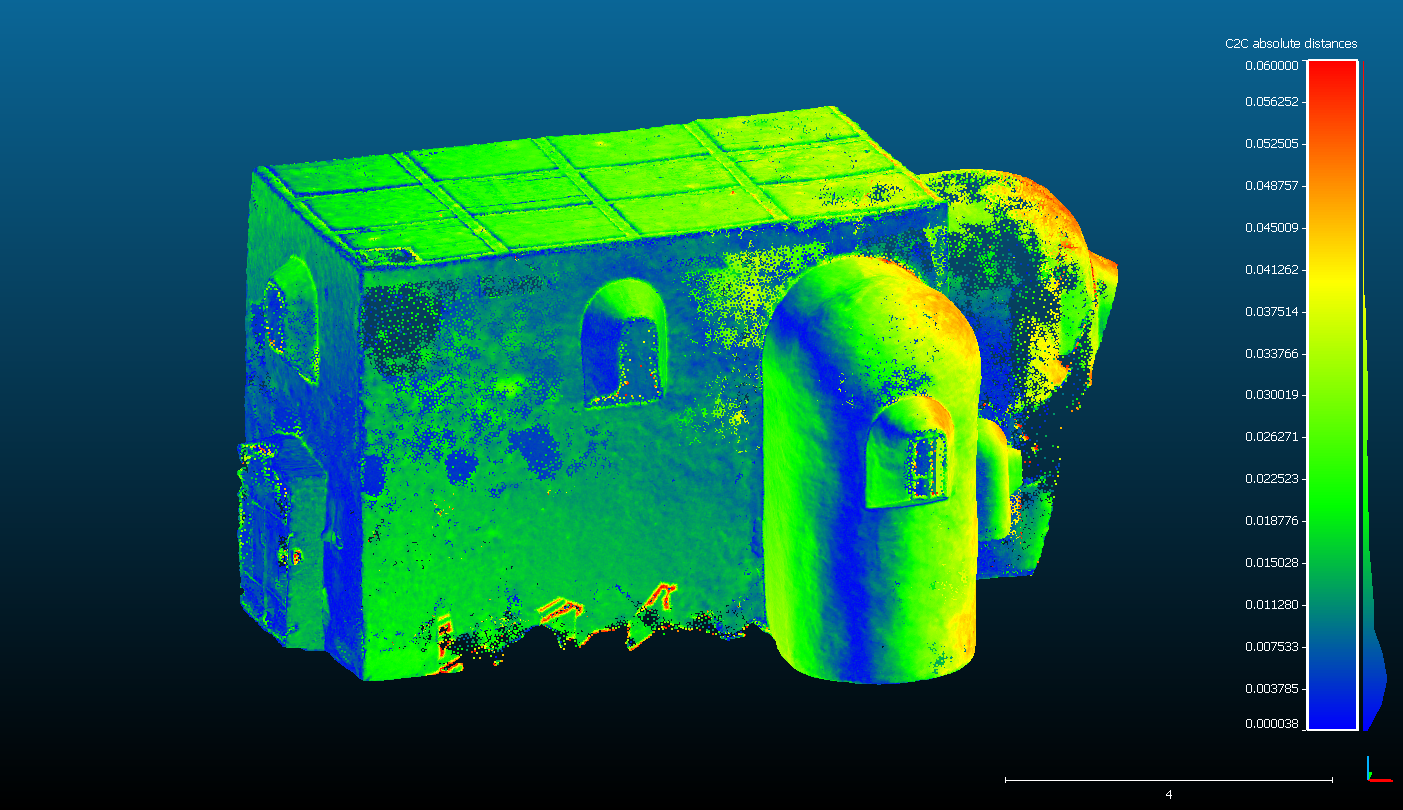 Figure 6. The comparison between Z+F and Nikon.
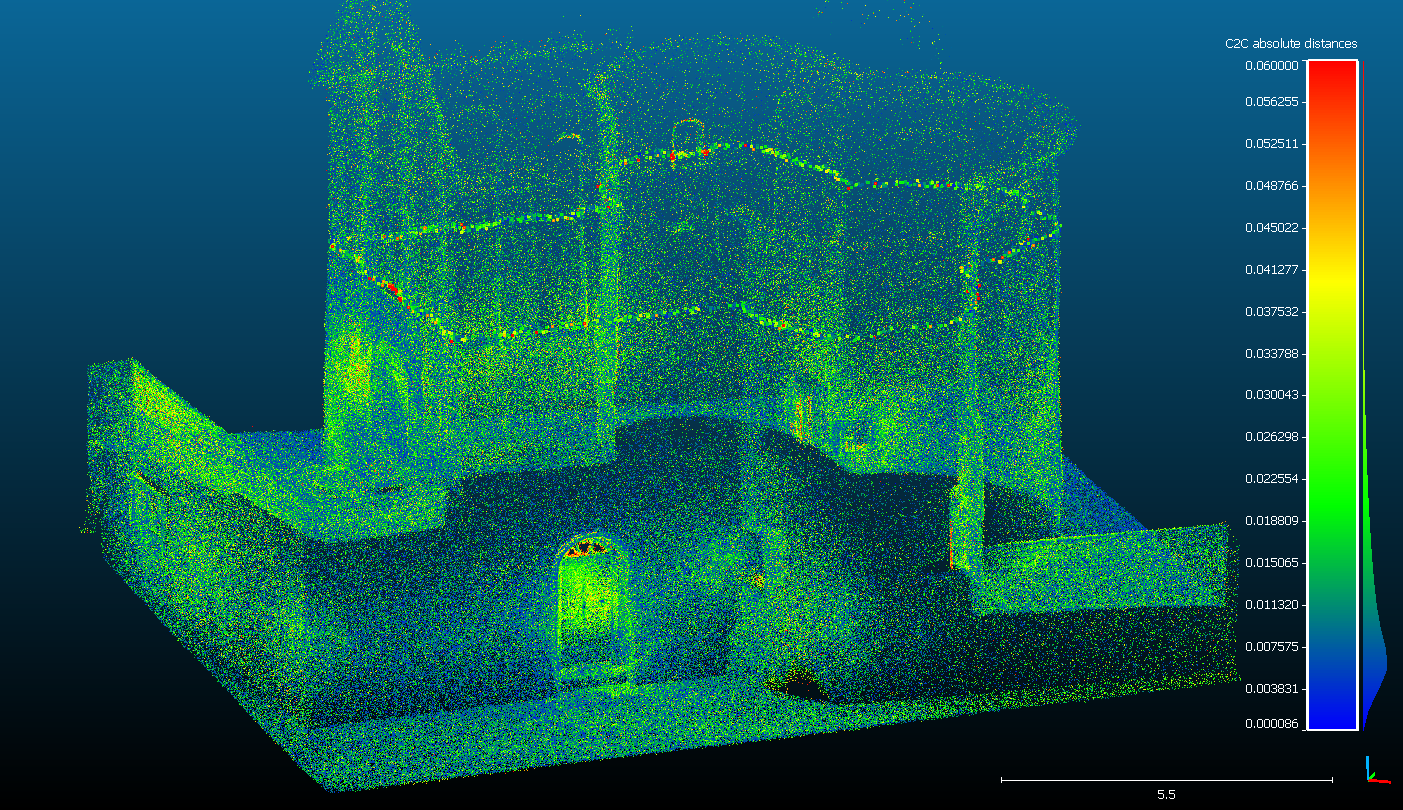 Figure 7. The comparison between Faro and GeoSLAM.
Overall, Z+F would be the first choice if pursuing the highest accuracy about 1 to 2 mm. If accuracy about 6 mm is needed, Faro ¼ resolution is recommended. It has the same accuracy as BLK of about 6 mm but with only 43 million points compared to 280 million for BLK. Fewer points will decrease the workload for processing. While if not caring about the processing but easy operation, BLK is recommended since it is very light and easy to install.
GeoSLAM is a useful to get a quick and rough point cloud model for the object since it will do registration automatically in one scan. While it was not successful adding the data from the video recording, which should be done with the software GeoSlam Hub. The reason for this might be that the camera was not connected correctly with the GeoSLAM instrument. Actually the GoPro's videos were taken orthogonal to the scanning direction.